College Profile 2017-2018
Total enrollment: 5547
New Degree Students: 1743
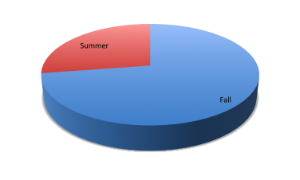
Fall Enrollment: 1265
Summer Enrollment: 478
There are 5,023 students enrolled at Teachers College. Approximately 77 percent are women, and among US Citizens, 13.3 percent are African American, 14.6 percent are Asian American, 13.5 percent are Hispanic / Latino/a, and 3.5 percent have identified with two or more ethnicities. The student body is composed of 20.4 percent international students from seventy-seven different countries and nearly 80 percent domestic students from forty-eight states and the District of Columbia.
Total enrollment: 5547
New Degree Students: 1743
Fall Enrollment: 1265
Summer Enrollment: 478
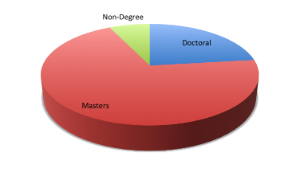
Masters: 3865 (70%)
Doctoral: 1284 (23%)
Non-degree: 398 (7%)
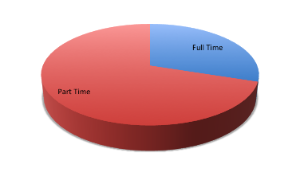
Full-time: 1666 (30%)
Part time: 3881 (70%)
Median Student Age: 30 years
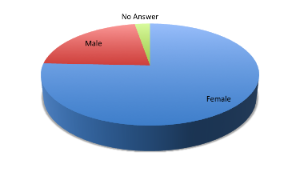
Female: 4197 (76%)
Male: 1201 (22%)
No Answer: 149 (3%)
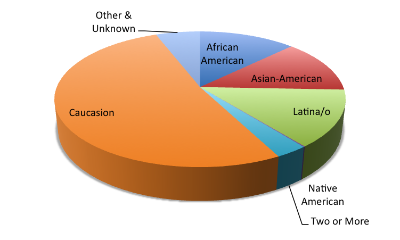
African-American: 557 (12.7%)
Asian-American: 564 (12.9%)
Latino/a: 594 (13.6%)
Native American: 6 (0.1%)
Two or More: 134 (3.1%)
Caucasian: 2266 (51.8%)
Other & Unknown: 256 (5.8%)
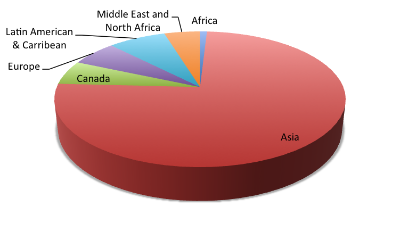
International students: 657
Africa: 6 (0.9%)
Asia: 492 (74.9%)
Canada: 38 (5.8%)
Europe: 40 (6.1%)
Latin America & Caribbean: 50 (7.6%)
Middle East & North Africa: 31 (4.7%)